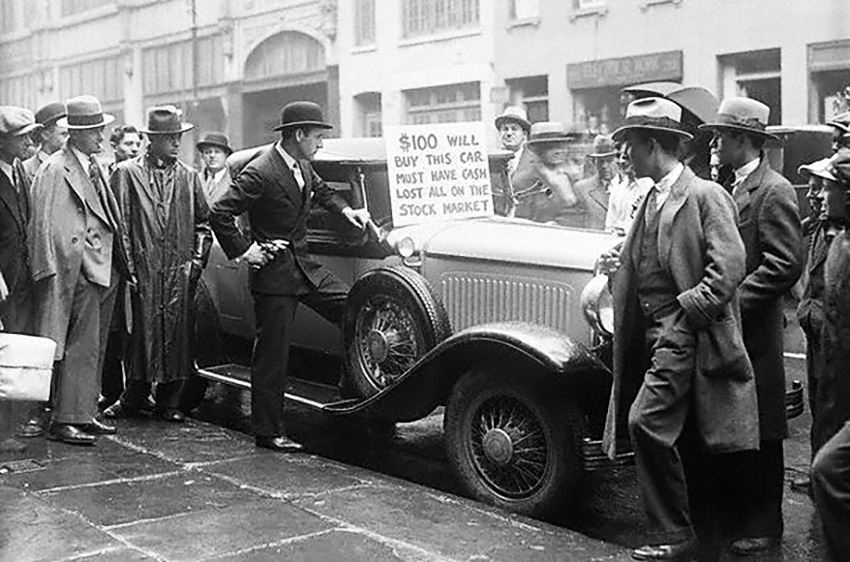
What was the ‘Stock Market Crash Of 1929’
The Stock Market Crash of 1929 began on October 24. While it is remembered for the panic selling in the first week, the largest falls occurred in the following two years. The Dow Jones Industrial Average did not bottom out until July 8, 1932, by which time it had fallen 89% from its September 1929 peak, making it the biggest bear market in Wall Street’s history. The Dow Jones did not return to its 1929 high until November 1954.
BREAKING DOWN ‘Stock Market Crash Of 1929’
The stock market crash of 1929 followed a bull market which had seen the Dow Jones rise 400% in five years. But with industrial companies trading at price-earnings ratios of 15, valuations did not appear unreasonable after a decade of record productivity growth in manufacturing – that is until you take into account the public utility holding companies.
By 1929, thousands of electricity companies had been consolidated into holding companies owned by other holding companies, which controlled about two-thirds of American industry. Ten layers separated the top and bottom of some of these complex, highly leveraged pyramids. As the Federal Trade Commission reported in 1928, these holding companies’ unfair practices — like bilking subsidiaries through service contracts and fraudulent accounting involving depreciation and inflated property values — were a “menace to the investor.”
A brief history of the 1929 stock market crash
- The stock market crashed in 1929, plummeting into a correction.
- Margin buying, lack of legal protections, overpriced stocks and Fed policy contributed to the crash.
- There are ways to protect investors’ portfolios from downturns.
On October 16, 1929, Yale economist Irving Fisher wrote in the New York Times that “Stock prices have reached what looks like a permanently high plateau.” Eight days later, on October 24, 1929, the stock market began a four-day crash on what became known as Black Thursday. This crash cost investors more than World War I and was one of the catalysts for the Great Depression. Irving Fisher’s declaration went down as the worst stock market prediction of all time.
Before the 1929 stock market crash: Risks and warning signs
Hindsight is always 20/20 but in the Roaring Twenties, optimism and affluence had risen like never before. The economy grew by 42% (real GDP went from $688 billion in 1920 to $977 billion in 1929), average income rose by about $1,500 and unemployment stayed below 4%. In the wake of World War I, the U.S. was producing nearly half of global output and mass production made consumer goods like refrigerators, washing machines, radios and vacuums accessible to the average household. Investing in stocks became like baseball – a national pastime. As newspaper headlines trumpeted stories about teachers, chauffeurs and maids making millions in the stock market, concerns about risk evaporated.
Why The 1929 Stock Market Crash Could Happen In 2018?
As U.S. stocks continue soaring to record high after record high, investors anticipating an inevitable plunge have yet another cause for sleepless nights. The CAPE ratio, a measure of stock valuations devised by Nobel Laureate economist Robert Shiller of Yale University, is now at a higher level than it was before the Great Crash of 1929, the Financial Times reports, adding that the only time the CAPE was even higher preceded the dotcom crash of 2000-02. However, the FT notes, there are some differences between 1929 and 2018 that make the CAPE parallel less terrifying for investors.
From their previous bear market lows reached in intraday trading on March 6, 2009, through their closing values on January 12, 2018, the S&P 500 Index (SPX) has gained 318% and the Dow Jones Industrial Average (DJIA) has advanced 299%. Regarding the CAPE valuation analysis, there are several key limitations.
Drawbacks of CAPE
According to investment manager Rob Arnott, the founder, chairman and CEO of Research Associates, CAPE has been on an upward trend over time. This makes sense both to him and to the FT since the U.S. as progressed from being essentially an emerging market to the world’s dominant economy during the course of more than a century. As a result, both believe that an increasing earnings multiple for U.S. stocks would be justified. While the current value of CAPE is above its long term trend line, the difference is much smaller than in 1929, as Arnott’s detailed research paper shows.
Reflective Reads: Articles that Make You Think

Blackrock geopolitical risk dashboard

Harnessing the Positive Divergence Vector Field

What Is Normalcy Bias Hiding from Smart Traders?

JetBlue Carl Icahn’s High-Stakes Airline Gambit

The Greater Fool Theory Newsroom: Illuminating Financial Fallacies

Steven Fiorillo Dividend Harvesting: Revolutionizing Portfolio Growth

