Experts Are Not Smart Enough to Spot Stock Market Crash 2017

Stock Market Crash 2017

Stock Market Crash 2017 boils down to all bark and no bite 

For the past few years much the angst of many experts we have consistently stated that the markets were not ready to crash. Moreover, we believe that Experts are not Smart Enough to Spot Stock Market Crash 2017. If they were they would not have made the same predictions in 2014, 2015 and 2016. All these predictions of disasters proved to be nothing but idle chatter.
From late 2016 to early 2017, many former Bulls who predicted the direction of this market quite well, suddenly decided that the stock market was ready to crash. We, however, begged to differ, and we provided two very simple reasons for our stance.

Experts Fail To Realise that Emotions drive the markets:

The masses have remained nervous throughout this bull run; no bull market has ever ended when the masses are nervous.  History indicates that stock market crashes begin on a euphoric note and end on a note of hysteria.

The trend clearly states that the Experts are on the wrong side of the Stock Market Crash 2017 argument 

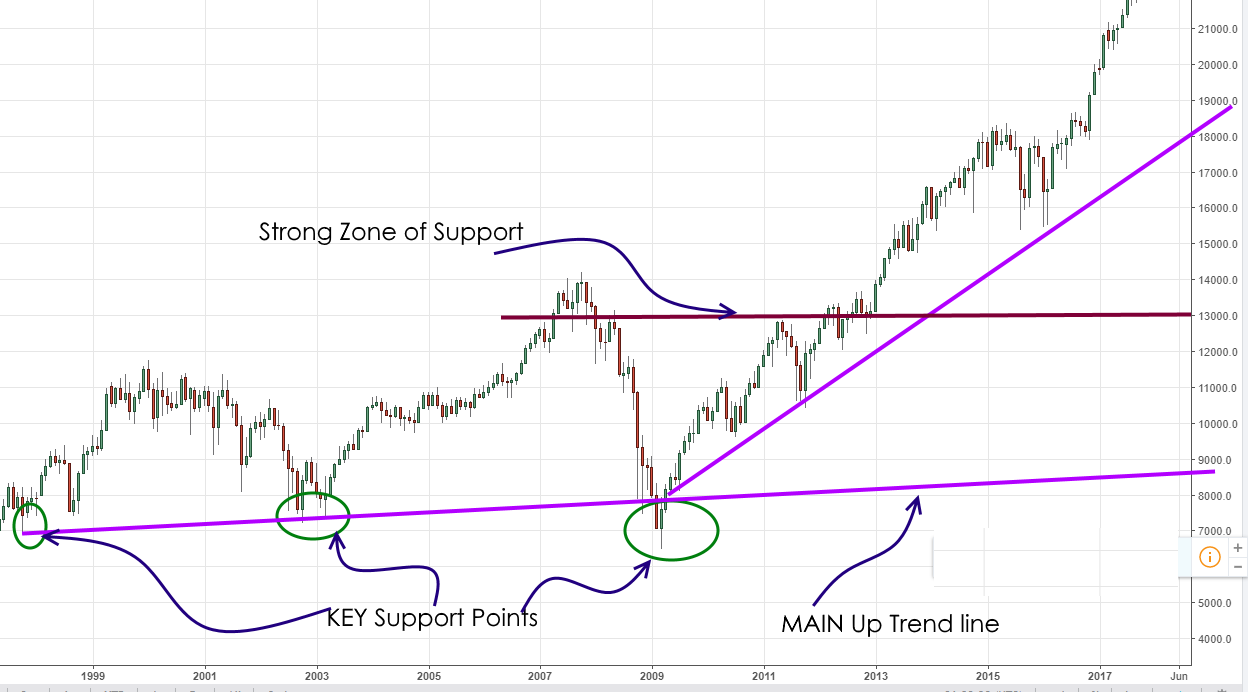
We focus more on the psychology of the masses than on any other single factor. However, the 2nd most important factor is the trend. The trend has remained positive throughout this bull run; occasionally it has moved into the neutral zone, but it has never turned negative.  We are not talking about the trend based on the drawing of simple trend lines but one that is calculated utilizing several factors one of which happens to price action.

So when the experts started to scream over and over again about the impending stock market crash of 2017; these are some of the comments we recently made to our readers and or subscribers

Let the experts sing their songs of doom and con the masses; it takes two to tango, one to cry and three to have a party. We have experts from the technical analysis side and experts employing fundamentals trying to use to back their faulty assertions. Unfortunately for these penguins both of them are wrong. They have failed to pay attention to the psychological factor. There is no factor more important when it comes to playing the markets then market psychology.  Market Update April 30, 2017

The market marches to its beat and those that resist are drained; financially speaking that is.  We are not fortune tellers; we reserve that noteworthy task for the experts who seem to take delight on spewing rubbish week after week. The media then regurgitates this rubbish, and a jackass is suddenly made to look like a movie star. What a wonderful world we live in and people wonder why they lose money after listening to these wise men.

We, on the other hand, prefer to listen to what the market is saying and that is why we never listen to our gut instinct or let our emotions into the equation.  We look for trends. Market Update May 19, 2017

Stock market crash anxiety index

 What’s The most nonplussing factor in this bull market?

The emotional state of the masses; the herd, for the most part, has been oscillating back and forth from the neutral to the Bearish camps; very few have dared to venture into the bullish camp. This probably explains why the bullish readings never even came close to testing the 60% ranges for the past 15 weeks and counting. During that time the market has been trending higher and higher. This has caught many an expert with his pants down. But there is no surprise here; the reason as we have stated so many times over and over again is that the Crowd is not euphoric and the trend is still bullish.


The same pattern holds true for most of 2015 and 2016; the number individuals in the Bearish and neutral camps outnumbered those in the bullish camp. If you are in the Neutral camp one of two things one of two things apply; you are either are a bear that got burned or Bull with no courage to take a position.

Our proprietary sentiment indicator also confirms that the masses are still antsy.

Market Structure

If the markets were extremely overbought, then it should be almost impossible to find stocks that are trading in the oversold ranges on the monthly charts. On a monthly chart, each bar represents one month’s worth of data on; these charts provide great clues of what to expect from the markets.

In the Dow, we spotted several stocks that were trading in the extremely oversold ranges to oversold ranges on the monthly charts.  AAPL, HD, DIS and NKE are examples of such stocks.

We also examined roughly 150 random Midcap to large cap stocks (ETF’s were included in this analysis) from various sectors; we found that almost 60% of the stocks examined were trading in the oversold ranges; one ETF that caught our eye was IBB; it is trading in the extremely oversold ranges.

We also noted that the net number of new 52 week highs continuously exceeded the net number of new 52 week lows. Why is this important? It indicates that the internal structure of the market is healthy.

Tactical investors Alternative Dow theory states that the experts have it wrong

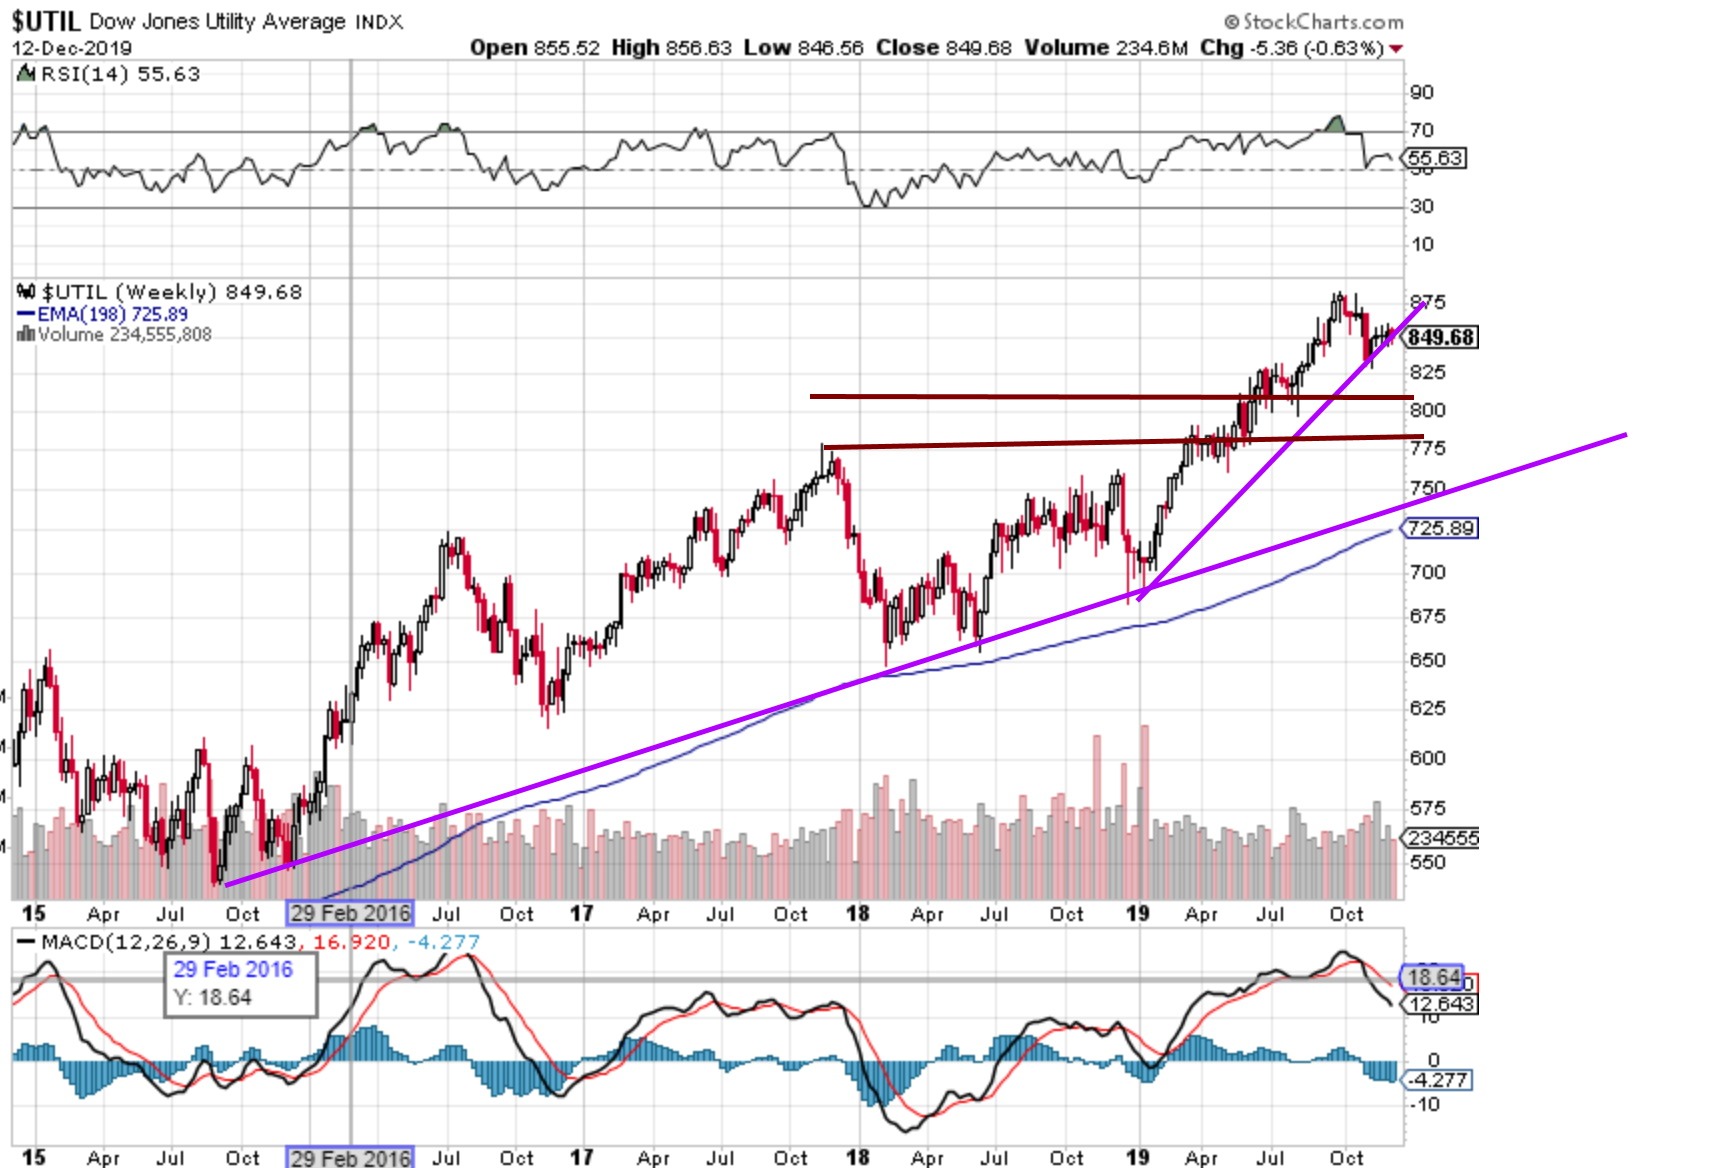
Our stance for the past 11 years has been that the Dow Theory is dead; we provided an alternative Dow Theory that has proven to be far more accurate than the original.  This theory states that it is the utilities that should be followed and not the transports. We will cover this in more detail in a follow-up article next week. In essence, it is the Utilities that lead the way and not the transports.

Tactical investors Alternative Dow theory states that the experts have it wrong

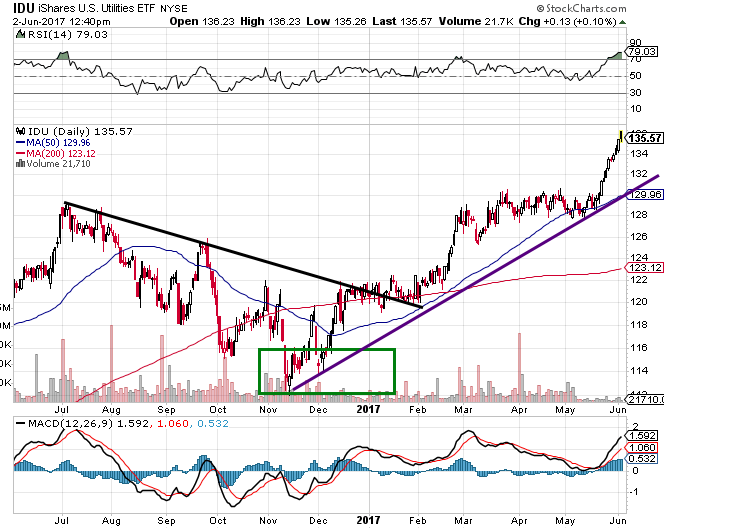
The utilities started to consolidate roughly from Aug of 2016 and bottomed out in Nov 2016 and had consolidated for roughly three months before they started to trend upwards. The utilities are now surging to new highs, and this bodes well for the overall market. The alternative theory states that the Dow should follow suit.

This is a mature bull market so one should not expect it to trend in one direction only; it will experience several corrections ranging from mild to severe. Unfortunately, the Dr’s of doom will confuse this correction for a crash as they have mistakenly done so for the past eight years and counting. When the masses embrace this market, the end will be close at hand; until then strong corrections should be embraced.

Dow theory states experts wrong

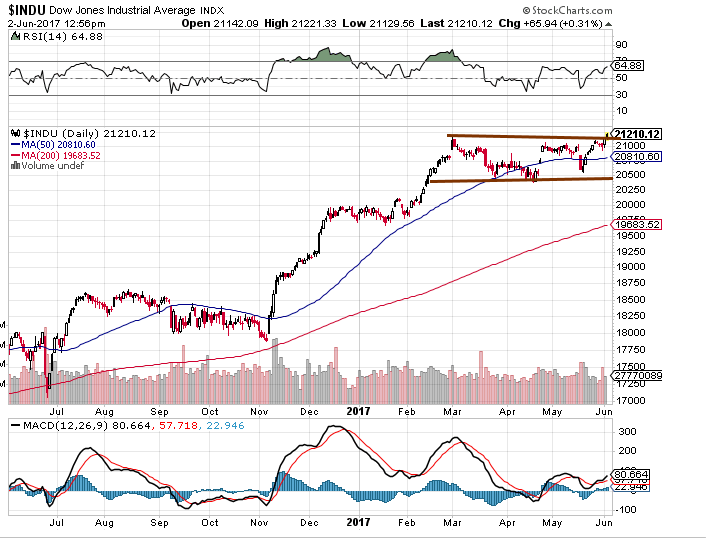
There is a lag period between the utilities and the Dow; sometimes it comes down to just a few weeks, but usually, it ranges from 3-5 months.  The Dow has been consolidating since March; it has essentially been trading in a tight range. Even though the Dow did not pull back strongly, the sideways action helped it blow out a large dose of steam as envisioned by the MACD’s and several other technical indicators that are trading in the oversold ranges. The lag period was roughly three months as the utility bottomed out in Nov and the Dow started to consolidate in March of 2017.


The stock market crash theme makes for great headlines as fear sells well, but that is all it has been good for so far.  The market will experience a much stronger correction over the course of the next 6-15 months, but until the masses embrace this bull market, those corrections will prove to be buying opportunities.

The overall Market sentiment illustrates that the masses are not jumping with joy.  The trend is positive, and the Dow Utilities have surged to new highs.  Therefore under such conditions, it is hard to envision a crash like a scenario.

Every bull market experiences one back breaking correction that is mistakenly labelled as the beginning of a new bear market. When that occurs, it will be a sign that the end is close at hand. That strong correction will subsequently trigger an even stronger rally and fuel a feeding frenzy. Sentiment will turn bullish, and the masses will dance with Joy, then the bottom will drop. However, we are not at this stage, so there is no point in further developing this story line.

Our ideal setup would call for the Dow to shed 600-1000 points over a very short period; this would drive the masses into the hysteria zone. A small push is all it would take to drive the fear factor through the roof. We all know what happens next; the masses stampede, the smart money swoops in, and history repeats itself once again. For the masses, it is groundhogs day every single day.


A genius can’t be forced; nor can you make an ape an alderman.

Thomas Somerville


Published courtesy of the Tactical Investor


Other Articles of Interst

No posts found.

Identifying Market Trends

Market Trends

Identifying Market Trends: Jump in Before the Masses do 

A new trend can begin that is based on fake news or false data to create the illusion all is well. Remember that the truth or lies are just a matter of perception. One person will swear that he is telling the truth, while another will swear that he is lying. From an observer’s perspective, both are correct.

They are convinced of their position, so all you will do is waste your time and energy trying to sway them. Instead, you are better of letting them battle it out, while you sit down and take a look at the real events that are unfolding, most of which the masses are oblivious too. The main principle of trend investing is not to focus on the noise factor but to pay attention to the “reality factor”. In other words, trend investing focuses on what is going on minus the morality or judgemental angle.

 The  observer’s perspective to Identifying Market Trends 

Personal views are on par with toilet paper regarding their relevance in determining trends. Oh, by the way, we also include ourselves into the equation. This is why we do not voice our personal opinions as nothing will change, and if we let our personal opinions cloud our judgement, then the ability to look at the situation objectively is lost.

Over time it gets easier and easier to do this, and then one day you wake up, and it is almost like breathing. Practice makes perfect, and there is no better time to start than today for tomorrow never comes. Today is the tomorrow you dreamed of starting something new yesterday but never did and most likely never will.   If you want to spot new trends you can’t allow your emotions to do the talking; once you emotions talk, logic goes out the window and stupidity

Keep Your Emotion in Check when Identifying Market Trends

In order to spot new trends one should not allow one’s  emotions to do the talking; once your emotions take over, your logic goes out the window and stupidity is in charge of the situation.  This is the first principle you need to muster before you can develop the ability to spot new trends.

A Trend in Motion Is unstoppable 

Whether you and I agree with it or whether it is morally right or wrong is irrelevant. Nothing can stop a trend in motion. This bull market is a perfect example of fake news driving a new trend; all the data imaginable has been manipulated to create the illusion that the economy is doing well. If we had allowed our personal opinions to dictate the way we trade, then like all the fools out there we would have missed the biggest bull run of all time.

Trend investing provides you with the opportunity to see the real picture as opposed to the one the mass media forces you to focus on. The idea is to sell when the masses are dancing and buy when they are nervous.

The trend is your Friend

Trend investing states that the trend is your friend, everything else is your foe. Mass Psychology clearly states that the crowds always oppose the trend and as a result, they are always on the losing end of a trade.

Posted courtesy of the Tactical Investor

Despised Bull Market Will Continue to Trend Higher

Despised Bull Market Will Continue to Trend Higher

The Most hated bull Market is not ready to drop dead 

Throughout this bull-run, a plethora of reasons has been laid out to indicate why this bull should have ended years ago. Mind you most of those reasons are valid, but that is where the bucket stops. Being right does not equate to making money on Wall Street. In fact, the opposite usually applies.  The Fed recreated all the rules by flooding the markets with money and creating and maintaining an environment that fosters speculation.

So why is this the most hated Bull Market

The reason this is the most hated bull market in history is because there is nothing logical reason to justify it.  In the 2008-2009 volume on the NYSE was in the 8-11 billion ranges and sometimes it surged to 12 billion. Before that, every year, the volume continued to rise, this indicates market participation. From early 2010 volume just vanished, it dropped to the 2-3 billion ranges and even lower on some days.   Hence, all market technicians and students of the markets assumed that the markets would tank as markets cannot trend higher on low volume and that is where they erred.

Share buybacks  are pushing this bull Market higher

We were and still are in a new paradigm, just as the US uses shell companies or brokerages to mask their trades in the US, they employ the same trick in overseas markets.   The US government stepped in and started to support the market directly that is why volume dropped so dramatically. However as there were no sellers, the markets drifted upwards. Later on, they got the corporate world in on the scam.   They set up the environment that propelled corporations to buy back their shares by borrowing money for next to nothing and then using this trick to inflate their EPS, without doing any work or even increasing the profitability of the company. Mass Psychology states that the masses are destined to lose; do not follow the crowd for they will always lead you

Mass Psychology states that the masses are destined to lose; do not follow the crowd for they will always lead you astray.In between a few minor corrections were allowed to transpire almost all of which took place on ever lower volume, to create the illusion that there was some semblance of free market forces at play.

Dark Pools could be contributing to Hated bull Market Run

We also have something known as Dark Pools, this, in essence, allows big companies to purchase large blocks of shares without the trade showing up on the NYSE or any other major exchanges. In essence, it gives the government an avenue to manipulate the markets without actually leaving a footprint.  As the US can print as much money as it wants, this is a perfect backdrop to do whatever it wants.  By the way, don’t believe the hogwash that our debt is only 18.9 trillion.  There is no real mechanism in place to check how much money the US creates.  Nobody is allowed to audit the Feds books.

How to handle this Hated bull Market

The Fed is hell bent on forcing everyone to speculate, and that is why we have moved into the next stage of the currency war games and the era of negative interest rates.  Negative rates will eventually force the most conservative of players to take their money out of the banks and speculate.  This process will be akin to another massive stimulus and will provide the bedrock for another huge rally.

Make a list of stocks that you would like to own and use strong pullbacks to add to or open new positions in.  Some examples are OA, AMZN, BABA, GOOG, CALM, CHL, etc.

Published courtesy of the Tactical Investor

The Psychology of Contrarian Investors

Contrarian Investor

A contrarian investor focuses on the facts and not the noise

We are going to use the precious metals to illustrate some of the Psychological principles of being a Contrarian investor. Keep in mind that most contrarian investors are not real contrarians but fall under the category of Fashion contrarians.

Contrarian investing is based on taking a position that is opposite to that of the masses. In general contrarian, investors get in an investment too early as their analysis is based on doing the opposite of the masses.  In contrast mass psychology dictates that you wait for the emotion to hit a boiling point, euphoria or panic before a position is taken. Mass psychology involves the actual study of what the masses are doing as opposed to just determining that their current action is wrong and using that information to take a position in the opposite direction.

A contrarian Investor takes a position that is contrary to the Masses

Contrarians only take a position that is contrary to the masses and that about wraps up the ideology of being a contrarian today. Very few of today’s contrarians are true contrarians; they fall into the category of fashion contrarians.

Contrarian Investors Psychology Zebra

Investors that adopt the doctrine of mass psychology correctly look for something more.  Mass psychology takes the principle of contrarian investing and then pushes it to the next level.

Mass psychology focuses on extreme situations

Students of Mass Psychology look for extreme type situations. In other words, sentiment should not just be bullish before an opposing strategy is put into play, it should be at the boiling point and only then will the student of mass psychology look for an exit and attempt to take an opposing position to that of the masses. To illustrate this point, we will use the following example.

The commodities sector has several components to it, two of them being the Gold and Silver. Throughout 2002 and early 2003, the hate and disgust for both these sectors were extremely high. Fast forward to 2004 and Gold was being mentioned everywhere; even CNBC had a little ticker that stated what the price of Gold was throughout the day. The hate or disgust for both these sectors was no longer there, and even though both these sectors have a long way to go before the masses fully embrace them, they did not provide a psychological basis for taking an opposing position to that of the masses in  2004.

Gold went on to soar to untold heights, heights that most would have deemed impossible in 2003. All along the way we continually stated that Gold would continue to trade higher and higher until 2011. We warned our subscribers to bail out of Gold very close to the top.

 A Contrarian Investor pays close attention to what the masses are doing

Even though the masses have still not fully embraced Gold, this concept does not matter in the long run. A more important criterion would be to find out what % of investors has taken positions in these sectors or not. Next one would try to find out what the Gold bugs (the most bullish individuals ever created on earth) are doing. If all the Gold bugs are bullish, then based on the contrarian rules of investing you should take a contrary to a neutral position because all the individuals in your group are now optimistic.

Do not pay attention to the masses; they know not what they are doing when it comes to investing

Should one care what the masses are doing that much or focus on the Gold bugs (the group) that are emotionally tied up with Gold?  The masses in general, will not embrace Gold fully until it becomes fashionable and by then a large portion of the Bull Run will be a thing of the past. In the last Gold Bull Run, the masses did not even know what was going on, let alone take a position in this sector.

So one measure would be to determine if all the people who believe in Gold have already taken positions if they have then the market has become saturated. The only way the market can continue its upward run is for momentum players to jump on the bandwagon.  These players have very short time spans of concentration, and thus, they jump in and out very fast. Once they decide to bail out the corrective phase could be very painful as was the case of precious metals topped out in 2011.  The housing collapse and internet bubble serve as two stark reminders of what happens once momentum has run its course.

A Good Contrarian Investor understand the core principles of Mass Psychology

Mass psychology is the constant analysis of the playing field to determine how the game is being played. Are the rules changing, are the players become more aggressive or docile, is the playing field soft, rocky or worse yet on extremely high and treacherous ground.  One has to take measures at different levels and then compare it the pattern you have already established from past observations.

In this sense, mass psychology is dynamic compared to the methodology most contrarians put into play. Contrarians do not measure their position relative to those of other contrarians; they only measure their position relative to that of the masses, and therefore, they fail to obtain a vital piece of data.  This usually results in pain, misery and taking on substantial losses   In, other words; they do not measure the intensity of emotion in their camp.

The gold bugs are a classic example of contrarian investing gone wrong. They moved from the Euphoric phase to the having found religion period, to the gnashing of teeth and pure misery phase, as they watched Gold plunge from 1800 ranges down to the 1000 ranges.  They still cannot fathom why this happened, especially as trillions of more dollars have been created since 2011.

The Internet boom lasted one-year longer after all the TA and contrarian indicators were in the extremely bearish zones. Euphoria for this sector was running sky-high.  If one had shorted the markets based on these contrarian factors only one would have lost one’s pants and well as underwear. In other words, you would have most likely lost a small fortune.

Gold bugs should have banked some of their profits. Instead, they continued to plough money into Gold, and as it pulled back, they jumped in joy and added even more. Once the correction moved from the mild to the wild phase, they panicked and started to pray. Today the sentiment is almost as bearish as it was in 2003.  From a long term perspective, a great buying opportunity could be at hand.

Be A true Contrarian Investor and not a fashion contrarian

Most so-called contrarians were caught flat-footed when the Equity markets mounted this huge rally from Oct 2004. Their contrarian indicators suggested that taking a short or neutral position was the right thing to do.  Only 10% of the investors can win at any given time. The moment the number surges past this level (no matter what side of the fence they are on contrarian or the masses side); the markets will adjust to bring this ratio back to its norm.

Investing based on psychology amounts to not only taking a position against the masses but also against the fashion contrarians.  Once sentiment has reached the boiling point, one should go into cash; risk takers can consider shorting the markets.  Finally, less attention is being given to the precious metals sector, so establishing a position now could be viewed as a prudent long term investment.

On the same token, most investors and experts expected the Market to Crash after Trump won and we stated that it would create a buying opportunity just as Brexit did. In fact, since 2013 we have been stating that a stock market crash was a long way in the making and that all strong pullback should be viewed through a bullish lens.

Published courtesy of the Tactical Investor


Mindful Escapes: Nurturing Intellect and Soul

Housing Market Fluctuations: Unveiling the Patterns Behind the Numbers

Housing Market Fluctuations: Unveiling the Patterns Behind the Numbers

Introduction to Housing Market Fluctuations The housing market is a dynamic entity characterized by its inherent fluctuations. These fluctuations, influenced ...
Benjamin Graham books

Discover the Graceful Art of Value Investing Through the Legendary Benjamin Graham Books

Introduction to Benjamin Graham and His Influential Books Benjamin Graham, often called the “father of value investing,” has left an ...
successful investing in stocks

Master the Secrets of Successful Investing in Stocks: Boost Your Financial Confidence

Introduction: Embarking on Your Journey to Successful Investing in Stocks Investing in the stock market can be intimidating, especially for ...

Bear Market nonsense: Experts want you to think Markets are Going to Crash 

Updated 10 June 2024 Are We headed for A Bear Market? The stock market crash story is getting boring and annoying ...
AMD vs Intel

AMD vs Intel

Updated 10 June 2024 AMD vs Intel: Can AMD maintain its advantage? “INTC has lost the leadership in process technology, ...
Dollar hits bottom

US Dollar Finally Hit Bottom?

Updated 10 June 2024 The US Dollar Finally Hit Bottom, and Gold could be heading lower Gold USD: The theme ...

Will Bitcoin Crash Chart

Bitcoin Crash Chart

Will Bitcoin Crash or Backbreaking Correction? (Bitcoin Crash Chart)

The dot.com insanity experienced a backbreaking amendment before the market launched and beat out toward the finish of 1999. The picture below represents that Bitcoin likewise experienced such an adjustment, but since of the expansive finish move it has all the earmarks of being only a blip. Tactical Investing amounts to combining Technical analysis with Mass psychology  creating a system that is second to none.  The Trend Indicator is an example of such a system.

Bitcoin Crash Graph

It combines the most important aspects of Mass psychology with the best of Technical analysis to yield a system that identifies the trend in advance of the event. Our technical indicators also enable us to identify crucial turning points in the market accurately.

Think about that from a high of 2977 (June 10, 2017); it dropped to a low of 1808 set on the fifteenth of July 2017; it shed generally 40% in that brief period (shown by the green box). Everybody recognizes what pursued.

Depressed people tend to depress everyone around them, however it keeps an eye on Pay’s all around inadequately over the long haul

It looks horrid, the media is siphoning apocalypse type situations, solid bulls are appearing of shortcoming, and even contrarian investing specialists are beginning to break. Unadulterated Contrarian Investors are more intelligent than the majority, yet they do have imperfections; the most astute financial specialists are the ones that put the standards of mass brain science into play.

They watch the mass outlook, and they comprehend that notwithstanding when dread begins to crawl into the condition, they are constrained to make this inquiry: Was the group in a condition of elation when the market beat out? On the off chance that the appropriate response is “no”, at that point regardless of how horrendous the image may look, the end amusement is that the group is being set up for a bogus descending move. Furthermore, the ordinary reaction would “why”. Basic answer, this is a propelled type of Pavlovian preparing.

The Bitcoin Crash Chart resembled the Tulip Bubble, it was a trick from the earliest starting point. The ones that made the cash were the ones that got in first, the ones that got in late were given their heads on a stinky tin platter. Never get into a speculation when the majority are euphoric, purchase when there is blood in the lanes and the other way around.

Financial exchange crashes are diverse as they don’t speak to one segment, so it is simply an issue of time before the business sectors will return to the standard. From a mass brain research point of view, financial exchange crashes are only long haul purchasing openings. Disregard the what occurs if the securities exchange crashes situation, and spotlight on what you would do if stocks you were biting the dust to possess before are currently selling for pennies on the dollar.

Pavlovian Type Training Is Being Used On The Masses

At the point when the market puts in a base subsequent to encountering a backbreaking remedy, and after that proceeds to mount an amazing rally; the group engraves the accompanying information in their brains. Purchase the pullback, since it is a phony snare to drive us out; they likewise begin to have confidence in the accompanying mantra “the more grounded the pullback, the better the chance”. Next time when the Market puts in a best, bullish slant will remain bizarrely high, and that will be the notice to understudies of Mass Psychology that the genuine skull pulverizing revision is en route. Once more, we point you toward the not very far off Bitcoin stupendous buyer advertise and the similarly fabulous accident. From low to high Bitcoin attached 11,000% in increases and the majority still expected that the main bearing it could exchange was up. When it bested the Bitcoin swarm was past overjoyed.

Concerning whether the bitcoin crash is finished, we trust that one should hold up somewhat longer before bouncing in and in every way that really matters, Bitcoin chart is exceptionally far-fetched to test the 20,000 territories for quite a while. On the drawback, bitcoin is probably going to test the 3000 territories with a conceivable overshoot to the 2,500 territories before a significant base grabs hold. Right now, there are numerous different stocks that look fascinating and unmistakably more appealing than bitcoin, for instance, PG, MRK, TCEHY, and so on.

Courtesy of Tactical Investor

Other Articles of Interest

No posts found.

Rate of Inflation not an issue according to Bond Market

Rate of Inflation not an issue according to Bond Market

The Bond market is Indicating that The Rate of  Inflation is not an issue in 2017 

Bonds should have continued to plunge, but notice that bonds bottomed in April and have started to trend higher. After the July rate hike, bonds should have taken out their April lows, but they did not.  Instead, they went on to put in a series of higher lows; higher lows are usually indicative of higher prices. Furthermore, the stock market hardly reacted to the last rate hike; after a very mild reaction, it has continued to trend higher.

rate of inflation

We tend to focus more on the technical and psychological outlook, and both are indicating that inflation is still not an issue.    The Gold market is also indicating that inflation is not an issue. Last July Gold traded past $1400; at that time rates were lower and the US dollar was trading at higher levels.  But today rates are higher today, and the dollar is trading lower than it was in 2016, but Gold instead trading at or above $1400 can’t even trade above $1300 for a sustained period.

Mass Psychology seems to support the theory that US inflation is not a big problem

The psychological factor does not support higher prices; the economy is not doing well as the consumer is not spending wildly. Consumer confidence is increasing, but consumer spending is not marching in tandem with consumer confidence.  Income growth is weak; the rise in incomes and net worth has primarily benefited high income and high net worth households. These are the same individuals that have the most money invested in the stock market which has tripled since its March 2009 lows.

We have listed a plethora of factors that illustrate that inflation is not an issue; at least not yet.

Even James Bullard, president of the Federal Reserve of St Louis went seems to be in agreement

“Low inflation has been the major surprise of the era,”

He also went on to state that he was still waiting for inflation to return to the 2% ranges and would not support any increases in the Fed’s benchmark rate until 2018 to allow inflationary forces to recover. He might have to wait a lot longer than that. AI and technology, in general, are going to continue to fuel lower prices. The retail sector is in freefall; the remaining players battle it out, and price wars will continue for the foreseeable future. Food prices are going to plunge due to the price war that new entrants like Lidl and Amazon have triggered.

The bond market is not supporting the higher inflationary outlook, in fact by all measures the bond market appears to be building momentum to trend higher.

US Jobs Report misses the mark

The unemployment rate edged up to 4.4% and wages barely grew. Only 156,000 jobs were added as opposed to the 180,000 consensus number.

The retail sector continued to get hammered; retailers shed 9,00 jobs, while the public sector shed another 9000 jobs.

“In months where there are anomalies like this, we look at the three-month average, which is 185,000,” said Michael Gapen, chief United States economist at Barclays. “The labor market is healthy, but we still have the conundrum that solid employment gains haven’t translated into faster wage growth.”

One wild card in the second half of 2017 will be gasoline prices. The surge following Hurricane Harvey’s devastation in Texas will leave less money for consumers to spend on other goods and services.

“For the economy, it’s steady as she goes, but for the markets, it’s Goldilocks,” said Torsten Slok, chief international economist at Deutsche Bank, referring to the not-too-hot, not-too-cold August payroll increase.  NY Times

The markets are holding up well and trending higher as we stated they would all along in 2016 and now in 2017.  Until the sentiment turns bullish the markets are expected to trend higher.

Price of Copper Signalling Inflation or higher Stock Market Prices

Price of Copper probably a bullish Development for the Stock market

Many pundits associate higher copper prices with inflation. This is the wrong metric to look at; higher copper prices are usually associated with an improving economy.

Copper has traded past a key resistance point ($3.00) and it has managed to close above this important level on a monthly basis.  The long term outlook for copper is now bullish and will remain so as long as it does not close below 2.80 on a monthly basis.   Copper is facing resistance in the 3.20-3.25 ranges and as it is now trading in the extremely overbought ranges. As copper is now trading in the extremely overbought ranges, it is more likely to let out some steam before trading past this zone.  A healthy consolidation will provide copper with the force necessary to challenge the 3.20 ranges and trade as high as $3.80 with a possible overshoot to $4.00, provided it does not close below $2.80 on a monthly basis.


Price of Copper Signalling Inflation or higher Stock Market Prices

Now that copper has traded past $3.00 on a monthly basis,  the Fed deserves another pat on the back for they have managed to further cement the illusion that this economic recovery is real. Copper is seen as a barometer for economic growth, so pulling off a Houdini here is probably going propel a lot of former naysayers to embrace this economic recovery.

Mass Sentiment is still Negative so Stock Market likely to Correct only


Combining this data with the action in the Copper markets leads us to believe that the stock market is more likely to experience a correction than an outright crash. Higher copper prices are usually indicative of higher stock market prices.  Therefore, the copper markets are confirming that the long term trend is still intact.

What about the Inflation issue?

The chart below puts an end to that argument for now. If inflation were an issue, the velocity of M2 money stock would be trending upwards. Until it starts to trend upwards, inflation is not an issue and the focus should be on higher stock market prices.


Conclusion 

Don’t focus on the noise; focus on the trend as it’s your friend and everything else is your foe.


Published courtesy of the Tactical Investor


Stock market corrections or stock market crashes


Stock market corrections or stock market crashes

Stock market corrections or stock market crashes: The Dow would have to drop below 9000 to break below the main uptrend line; an unlikely event in the near future. However, this does not mean it’s impossible. Every once in awhile the markets experience a monumental crash that can shave of as much as 60% of the Markets current value.   In this is instance we are using weekly charts; each bar on the chart represents one week’s worth of data.  Straight off the bat, you can see that back breaking corrections translate into long term buying opportunities.  Remember when there is blood in the streets and the masses are in panic mode, the opportunity is knocking.

Crashes are buying opportunities

Market Crashes are Buying Opportunities

The first zone comes into play at 16,000. If the Dow closes below this level on a monthly basis then there is a chance it could trade as low as 13,000.  However, based on the current market sentiment, there is very little likelihood of such a scenario coming to pass.  Mass Psychology is very clear when it comes to dealing with stock market crashes. Market crash on a note of Euphoria and bottom on a note of despair. Mass psychology states that optimum time to get into the markets is when the masses are in panic mode.


Anxiety index is a great market timing took


A fortress of support comes into play at the 13,000-13,500 ranges

To trade any lower than this level, the Dow would need to close below the above ranges on a quarterly basis. If it were to do that then the main uptrend line could be tested. Note that this trend will continue to trending upwards, so in 12 months, the trend line could move from the 9000 ranges to the 10,000 plus ranges.

Buy the Fear Sell the Joy 

The individuals who arrive at the party late are the first ones to come out and mistake a correction for a crash.The crowd panics when it sees blood in the streets; instead of joining the crowd do something different take advantage of stock market crashes and buy as the crowd dumps quality stocks and flees for the exits.

Crash or correction boils down to the angle of observance 

What is stunning to one, could appear ugly to another; it comes down to the angle of observance. Alter the angle and the image changes. Mass media and most experts try to alter the angle and direct you to see what they want you to see. They are in the fear “Selling Business” because fear sells, so they focus on creating a mountain out of a mole hill.

History clearly indicates that the Astute investors build very large stakes when there is blood in the streets.  Moreover, they keep building these positions as long as the main driving force is fear.  Take a look at the current Bull market; the Dow is trading at 22,000 and the masses are still nervous. It’s history in the making. The masses are always on the wrong side of the markets in the long run.

The astute investor always views financial disasters through a bullish lens.  Instead of panicking they take advantage of stock market crashes. 

Normality highly values its normal man. It educates children to lose themselves and to become absurd, and thus to be normal. Normal men have killed perhaps100, 000 of their fellow normal men in the last fifty years.
R. D. Laing
1927-1989, British Psychiatrist

Published courtesy of the Tactical Investor


Recent Articles

Bull and Bear 2019: Which one is the winner?
Buffett Indicator Is Predicting a Stock Market Crash: Pure Nonsense
Experts Are Not Smart Enough to Spot Stock Market Crash 2017
Bear Market nonsense: Experts want you to think Markets are Going to Crash 
Identifying Market Trends
What Every Investor Should Know about the Dow Theory?
US Dollar Finally Hit Bottom?
Bitcoin Crash Chart
Dow 22K Predicted In July 2017; Next Target Dow 30k?
Stock Market Crash Of 1929
Nothing about 1987 stock market crash anniversary
Politics and Technology

Stock Market outlook and the future of the work

Stock Market outlook and the future of the work

Stock Market Outlook: As stated in the stock market update, its buddies would do anything it took to make the belief that shorting the market is a recipe for failure. The idea, as we mentioned, is and was, to induce every Tom, Dick and Harry to adopt this bull. One just has to consider Monday’s actions to determine just how much they are willing to move thus, whatever crap they pump out from the information, that pullback will solve itself since the Fed and its allies will come out to drive money to the markets or directly intervene by encouraging the system.

As detailed at FAQs that are upgraded and also a term sheet, the SMCCF will buy bonds to make a bond portfolio that’s based on a broad market indicator of US bonds. This indicator consists of the bonds in the market which were issued by US firms that satisfy other standards of adulthood, along with the facility score. This indexing strategy will match the current buys of funds for the facility.

The Markets were yanking on Monday, and the Fed comes out and leaves viola and that statement. They aren’t even allowing the Dow to examine the 23K ranges. In the long run, these bears will wind up turning to bulls, and that is going to mark the conclusion of the cycle, which is accompanied with a crash, which may indicate the baby bull’s arrival. US Stock-index stocks were higher Tuesday afternoon, aiming to add to the rally of the day that President Donald Trump has been currently financing a $1 trillion infrastructure spending bundle to include more stimulus to help the economy recover from the pandemic.

We said that an infrastructure bundle would be published since the COVID pandemic has granted the ability to the Fed and the authorities. Watch the creativity here. Produce an issue and offer whilst creating the pay to offer a solution. Look they’ll create more if needed and how many trillions of dollars they’ve created over the last 7 weeks. Notice something else; lots of Folks are shedding their tasks or will. As we mentioned the most expensive element in any company is the element that is human. If you’re able to eliminate high paying jobs and continue to boost efficacy with
machines.

The effect is deflationary regardless of the inflation by generating bucks generated. The Future Of Function: It begins with distant working. They’re pushing an increasing number of individuals to work at home. What happens next? Then why would they be in the USA In the event employees working at home do too the task? See another point: they will begin talking about outsourcing those tasks or notify Americans that they must work for work or less out of a different nation for less. And this will happen on a worldwide basis. All in all, the benefactor from this activity will be parts of South America, parts of Eastern Europe and Asia.

We will expand this further. Therefore, while America will continue to flourish employees irrespective of the ranking they hold and will probably be a place, won’t fire well. At the

In the era of AI, also the self-employed which have and the businessman. There are exceptions, and yet another approach is to be certain to stay ahead of the learning curve; Quite simply, you are great at your work. The alternative when you’ve got a job that is fantastic would be to learn more about the idea of becoming an independent contractor; if this approach is executed 35, occasionally, the advantages can be immense.

As the money supply will continue increasing for the near future, we’re currently reaching the point at which it makes no way to concentrate on stock market crashes. For, in reality, it is a stock market crash in the event that you bought in at the top, however, it shouldn’t be regarded as a wreck but because the buying opportunity when a person began opening positions throughout the crash.

Monday’s action was confirmation that we will need to change tactics. We talked of
the in the previous two upgrades, and we’re likely to this new approach. Monday’s activity appears to affirm that it’s a waste of time to concentrate on any cycle’s crash facet.

Each stock market crash contributes to the arrival of a brand new bull market. This was the very first big-scale also the time a bull and crisis was killed before its own
time. Along with the wreck was over before it gained any traction. This action informs
intensity won’t last long and the majority of the bears will probably be captured with
Their pants were the situation with all the crash that is a coronavirus.


What do others think about stock market outlook and the future of the work?

Stock Market Outlook: 3 Volatile Weeks, Then Pure Excitement

The stock market is about to evolve – from guesstimate volatility to fundamental trend building. But, first, it needs to close out this quarter’s final trading days and pass through the third quarter’s startup time until it reaches…

… the morning of July 14, when DJIA lead-off JPMorgan Chase JPM -2.7% reports second quarter results, and CEO Jamie Dimon makes good on his 3-month-old promise to reveal the bank’s new strategy and outlook.

Will his comments be positive, negative or a combination? Who knows? However, what we do know is that the information will be valuable and will be based on facts, insight and wisdom. And that means investor excitement because actual business fundamentals and reasoning are reentering the stock market discussion.

Gone will be the dependence on invented “breaking news” and simplistic “analyses” based on linking trader-driven stock market moves to any coincidental tidbits lying around.
What about the elephant in the room: Covid-19?

Oh, it’ll still be with us. However, its overwhelming uncertainties in early April have greatly diminished. Today, most government, institutional and business leaders know what needs to be done, both to function effectively and to contain, if not reduce, the risk of contagion. Read more

JPMorgan’s market guru says stocks can hit new records this summer

Stocks’ price-earnings ratios remain at historic highs, but their value compared to bonds suggests a market booster could be on the horizon, Marko Kolanovic, head of macro quantitative and derivatives research at JPMorgan, said Wednesday.
Central banks’ relief programs prompted an exodus from equities and flooded the bond market with investor cash.
Yet quantitative funds’ trading algorithms are on the verge of triggering a return to the stock market as volatility eases, Kolanovic wrote in a note.
For such firms to reach their median equity exposure, they’d need to add $400 billion to the stock market. A move like that would serve as a shot-in-the-arm for stock valuations and “easily push the broad market to new highs,” the analyst added.
The market is also slated for a mass rotation from growth names to value stocks once investors reprice for weaker-than-expected coronavirus fallout, the bank said.
Visit the Business Insider homepage for more stories.

Stocks sit at historically expensive levels but not in the way that matters most, JPMorgan said Wednesday.

Price-earnings ratios remain elevated, but prices relative to bonds are the signals to watch for future market moves, Marko Kolanovic, head of macro quantitative and derivatives research at the bank, wrote in a note to clients. Stocks are currently “quite cheap” by that measure, and the dislocation is directly tied to a decline in bond yields, he added. Read more


Where the Stock Market Will Be in Six Months

When it comes to the future of the stock market, investors’ predictions are all over the map.

When asked where the S&P 500 Index would end the year, a fifth of respondents to a survey conducted by DataTrek Research said the benchmark will close out 2020 up more than 10% from current levels. That’s roughly the same number who predicted the index will finish down more than 10%.

“Every option from ‘really bad’ (down +10% from here) to ‘really good’ (+10%) got basically the same number of votes,” Nicholas Colas, DataTrek’s co-founder, wrote in an email. “And we’re only talking about the next six months.”
Such dispersion is perhaps understandable after the stock market’s fastest-ever fall into a bear market gave way to the quickest 50-day rally in nine decades. While investors are hopeful for a quick economic recovery from the coronavirus pandemic, the outlook is foggy as cases continue to rise and new risks emerge. Investors also have a wary eye on November’s U.S. presidential election and the potential for volatility around that time.

According to the survey — which attracted 341 responses from June 22 through June 28 — 48% said they expect Joe Biden to win the presidency, compared to 43% who foresee a Donald Trump victory. According to Colas, political expectations weighed heavily on investors’ general market views.

“Respondents who said they believed Trump would win were twice as likely to think U.S. equities would rally by double digits into the year-end,” Colas wrote. Read more

Other Articles of Interest

No posts found.


Dow Jones Transportation Average

Dow Jones Transportation Average

Dow Transports Service Dow 30K Prediction?
Are trading to let some steam out. Then the Dow is very likely to undergo a pullback according to the Tactical Investor’s Dow Theory if the pullback is powerful. From the market update, 9300 to 9600 ranges’ goals were to the Dow moves. The programs (as displayed in the preceding graph ) are very likely to check the 802 into 819 ranges using a potential overshoot into the 765 into 774 ranges.

Right off the bat, we’re likely to say that we’re in favour of a much correction unless the trend varies since it will produce a purchasing chance. The chart of this transports illustrates they are currently at a zone of immunity; since the transfers are trading at the ranges around the graphs shown below, this immunity will be overcome. The transfers will need to shut on monthly basis above 11250. If they can attain this, support will be turned into by then immunity. A breakout may push this indicator up to 1800 to 2400 points greater from the zone.

Dow Jones Transportation Chart
Ranges the breakout effort by the Dow transfers is very likely to fail. The reverse is going to transpire, although this will convince everybody that the transport sector is currently going to breakdown. If the trade is transported by the Dow the likelihood of a transfer to the 9300 to 9600 will spike. If it comes to pass traders may load up on stocks in the transport sector.

The total trend is upward, and when a business is despised, it is most likely the time to
set up positions. The setup would call the Dow will follow in its footsteps and in doing so produce an excellent prospect to experience a pullback. Until the trend varies, an individual needs to ignore the impulse to fear if the market’s pullback strongly. The proposed course of action is to split out a jar of your favourite drink (alcoholic or non-alcoholic) and observe. According short-term traders can observe the 801 costs will be indicated by a violation of the zone.

Our future views on Dow Jones Transportation Average

When the utility pullback the Dow Industrials and Transports are very likely to take the exact same route and in doing so this will produce a purchasing chance that is lovely for 2020. Opinion has inched up the following 2 points and it’s nearly. Readings are well below their average of 39. Overall market sentiment is currently signalling a solid pullback needs to be seen as a chance when it comes to pass. The

Dow is trading over 28k, and the sentiment is still trading under its historic average. Simply speaking, we could conclude that year’s market activity will capture 90 per cent of specialists with their trousers down. Of the experts, even people who obtained the first portion of the bull market, are currently wearing their feelings on their sleeves. Can we understand? All one must do is pay attention? In case you’ve got a prejudice (be it governmental or politics ), your vision is clouded and consequently your own analysis.

Some readers have asked us do not brief the markets; our attention is on the long-term trend. We could guarantee that it is not Once it appears like it’s simple to assess the direction of this trend. We do not wish to be in doing so miss out on both ends and in a place where we’re stuck considering two tendencies in two different time frames. We are reminded by this of this narrative of the donkey that maintained searching for a more tasty haystack; of starvation, the fool died ultimately.

Thus, while the trend is upward, we’ll concentrate on the transactions that are extended and vice versa. Notice the market upgrade is a tool which may be employed to satisfy your requirements; hence in the event that you have time and are comfy with the market, you might do so. The very best method to decrease the risk variable when shorting the market would be to use put options; you know upfront how much you can lose.

In short, there’s absolutely no reason to fear, and when this sale continues at
this speed it will cause a monstrous purchasing occasion and this is the kicker, those who panicked will overlook it, for after fear sets in; it’s quite tough to distinguish between chance and catastrophe. Think back to 2008, also look at missed the ship since the
premise was that the markets may go lower.

Now given the intensity of the present sell-off, the markets will likely mount a rally, the very first effort usually fails, and when the history is to be reliable then when this rally fizzles out, it ought to result in another downward tide, which could take the market to fresh highs on an intraday basis.

If the pattern is sufficiently powerful, we can issue a term open the place up or put play. That is where you place with different strike rates and opens both a phone. Do not neglect to maintain a trading diary; if blood is flowing on the roads, the very time is.


What do others think about Dow Jones Transportation Average?

What Is the DJTA?

What Is the Dow Jones Transportation Average?

The Dow Jones Transportation Average (DJTA), sometimes simply known as the “Dow Transports” is a price-weighted average of 20 transportation stocks traded in the United States. The Dow Jones Transportation Average is the oldest U.S. stock index, first compiled in 1884 by Charles Dow, co-founder of Dow Jones & Company.

The index initially consisted of nine railroad companies and only two companies from outside the railroad industry. That is a testament to the dominance of railroads in the U.S. transportation sector in the late 19th and early 20th centuries. In addition to railroads, the index now includes airlines, trucking, marine transportation, delivery services, and logistics companies.
Key Takeaways

The Dow Jones Transportation Average (DJTA) is a price-weighted average of 20 transportation stocks traded in the United States.
In addition to railroads, the index now includes airlines, trucking, marine transportation, delivery services, and logistics companies.
The Dow Jones Transportation Average is closely watched to confirm the state of the U.S. economy, especially by proponents of Dow Theory.
Changes in the DJTA are rare, and they usually only happen following a corporate acquisition or other dramatic shifts in a component’s core business.

Understanding the Dow Jones Transportation Average

Transportation is much less important to the overall stock market than it was when the DJTA was first created. However, transportation stocks can follow a different pattern than the rest of the market. Sometimes, they can help traders and investors to predict changes in the market. Read more

Why DOW Transportation Average Is Actually Pretty Good When It Comes to Stocks

The average is an everyday word. We use it without even thinking about it. We want to know the average temperature, our favourite player’s batting average, the average home price in a neighbourhood.

That got us thinking about the average stock. It is, after all, the Dow Jones Industrial Average. And it is helpful to know what Wall Street thinks average is. That way, investors can discern when Wall Street loves or hates, a stock.

The most average stocks Barron’s could identify in the S&P 500 and the Dow are FedEx and JPMorgan Chase, respectively. We had picked FedEx (ticker: FDX) as a Buy recommendation in 2019 and JPMorgan (JPM) was featured on a 2019 cover story.

But what does average mean for a stock?

For starters, the average market capitalization in the S&P 500 is about $60 billion, but the median market cap is $23 billion. The S&P is a little top-heavy. On average, 21 analysts cover an S&P stock. The average Buy-rating ratio—which is Buy recommendations divided by total recommendations—for stocks in the S&P is about 53%. The average Sell-rating ratio is about 7%. Analysts are far more likely to rate stocks they don’t recommend as Hold instead of Sell. And the average analyst price target for an S&P stock implies a gain of about 6%. Read more

Will Dow Transports Trip This Bull Market?

The bull market’s fate now rests on just 20 stocks.

I am referring to the 20 stocks that make up the Dow Jones Transportation Average. At least according to some interpretations of the venerable Dow Theory — the oldest stock market timing system that is in widespread use today –, the bull market will not be considered alive and well until this average rises above its previous all-time high.

And that’s asking a lot since the Dow Transports are 12% below that level.

Why would Dow Theorists believe that the fate of the market rests in the hands of just 20 stocks? Therein lies a long story that I told three weeks ago and will not repeat here. But, in a nutshell, Dow Theorists focus on the behaviour of both the Dow Transports and its better-known sister average, the Dow Jones Industrial Average. Bull markets are considered alive and well when both of these averages are jointly hitting new highs.

Three weeks ago these averages had their work cut out for them since both were far below their April highs. But it turns that just the Dow Industrials were up to the challenge; while last week they rose to a new intra-day record, the Dow Transports remain far behind.

If anything, in fact, they are getting even further behind. On Monday of this week, when the Dow Industrials rose slightly, the Dow Transports dropped another 155 points or 1.5%.


Other Articles of Interest

No posts found.